Colorization of RFC 2992(Analysis of an ECMP Algorithm)
Motivation
I recently observed a conversation around ECMP/Hash buckets which made me realize on how the end to end concept is not very well understood. So this provided me enough motivation to write about this topic which will be covered in various upcoming blog posts. But while thinking about the subject, I ran into an interesting RFC RFC2992. This RFC goes through a simple mathematical proof which I found impressive due to the fact that someone wrote that in ASCII in 2000. My intent in this blog post is to provide some colorization to the RFC and perhaps cover a bit more in detail.
Introduction
In the RFC, the focus is on Hash-threshold implementation for mapping hash values to the next-hop. To re-iterate for completeness sake, we all know that a router computes a hash key based on certain fields, like SRC IP, DST IP, SRC Port, DST Port by performing a hash (CRC16, CRC32, XOR16, XOR32 etc.). This hash gets mapped to a region and the next-hop assigned to that region is where the flow get’s assigned.
For example,assume that we have 5-next hops to choose from and we have a key space which is 40 bits wide. We divide the available keyspace equally and allocate 8 bits per region to each of our 5 next hops.
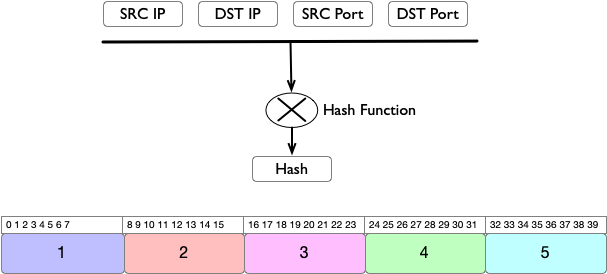
In order to choose a next-hop, we need to map the hash key to a region. Since the regions are equally divided, this becomes a very simple task.
Region_size = Keyspace Size/No.of Nexthops.
Region =  (key/region_size)
Sample snippet illustrating the concept
import math
region_size = 40/5 # KeySpace Size/No. Of Next-hops
key = [0,7,8,15,16,23,24,31,32,39]
for k in key:
    print(f"Key {k} Region: {math.ceil((k+1)/region_size)}")

Key 0 Region: 1
Key 7 Region: 1
Key 8 Region: 2
Key 15 Region: 2
Key 16 Region: 3
Key 23 Region: 3
Key 24 Region: 4
Key 31 Region: 4
Key 32 Region: 5
Key 39 Region: 5
Disruption of Flows
In this section, we will look at how much flow disruption is caused by the addition or deletion of a next-hop. Since the method requires to have an equal size allocation for next-hops, whenever a next-hop is taken out or added, the regions have to be re-sized. This will result into disruption for the flows if the key they were pointing to is allocated to a different next-hop. We are going to assume the amount of bits gets reassigned is proportional to the amount of flow disruption. The bigger the reassignment, bigger the flow disruption.
For instance, in the below figure, we have 5 Next-Hops. Assume that Next-Hop 3 get’s deleted. This results in the remaining regions to grow equally to compensate for the additional space created by the deletion.

In this case, we will have 8 bits free which means each of the remaining regions will get 2 bits each. This can be generalized by saying:
- Anytime a next hop is deleted,
1/Nbits gets free whereNis the number of next-hops \(\frac{1}{5} * 40 = 8 bits\). - Free bits get distributed equally by remaining
N-1next hops. You can generalize this by saying \(\frac{1}{N(N-1)} * KeySpace\). Example: \(\frac{1}{5*4} * 40 = 2 bits\).
Another thing to observe is that as the corner regions (1 and 5 in our example), expand inwards, this will cause the internal
regions to shift in addition to expand. For example, Region #2 which was starting from 8 now starts from 10 (to free space for #1)
and lies between 10 to 19. This brings a net change of 4 bits for region #2. Total bit change in our example is 12(2 + 4 + 4 + 2).
If we pick lets say region #4 this time for removal,then we are moving around 14 bits=(2+4+6+2).

If we pick region #5 for removal,then we are moving around 20 bits=(2+4+6+8).

Based on the above examples, we can make an observation that the least disruption is caused when the region getting removed is in the middle.
We can generalize the process of calculating the number of bits change and indirectly the amount of flows getting disrupted by
Assuming the Kth region is removed
Total Disruption = Total change of bits on the left of Kth region + Total change of bits on the right of Kth region
Total Change of bits on the left of \(K^{th}\) region can be expressed as
\[\begin{align*} \sum_{i=1}^{K-1} \frac{i}{N(N-1)} \end{align*}\]Total Change of bits on the right of \(K^{th}\) region can be expressed as
\[\begin{align*} \sum_{i=K+1}^{N} \frac{i-K}{N(N-1)} \end{align*}\]Combining both gives us the Total Disruption
\[\begin{align*} Total Disruption = \sum_{i=1}^{K-1} \frac{i}{N(N-1)} + \sum_{i=K+1}^{N} \frac{i-K}{N(N-1)} \end{align*}\]If the \(K^{th}\) region happens to be the right most region, then you skip adding the right part of the \(K^{th}\) or vice versa for the left most region.
Proof for minimal disruption
Following up from the above equation, you can take \(\frac{1}{N(N-1))}\) outside of the summation
\[\begin{align*} = \frac{1}{N(N-1))}\sum_{i=1}^{K-1} i + \sum_{i=K+1}^{N} (i-K) \end{align*}\]Partial Sums
You may be already familiar with the partial sums of the series where a sum of N numbers can be expressed as
In our case, we are adding K-1 terms in the first part which gives us \(\frac{(K-1)(K)}{2}\).
In the second part, We are adding numbers from 1 to N-K, which gives us \(\frac{(N-K)(N-K+1))}{2}\).
Substituting the above back into our original equation gives us
\[\begin{align*} => \frac{(K-1) K + (N-K)(N-K+1)}{2N(N-1)} \end{align*}\]After expanding the above expression and simplifying it, we get
\[\begin{align*} => \frac{2{K^{2}} -2K + N^{2} - 2NK + N}{2N(N-1)} => \frac{K^{2} - K - NK}{N(N-1)} + \frac{N+1}{2(N-1)} \end{align*}\]Let’s plot the above expression and see the shape of the function for few values of N.
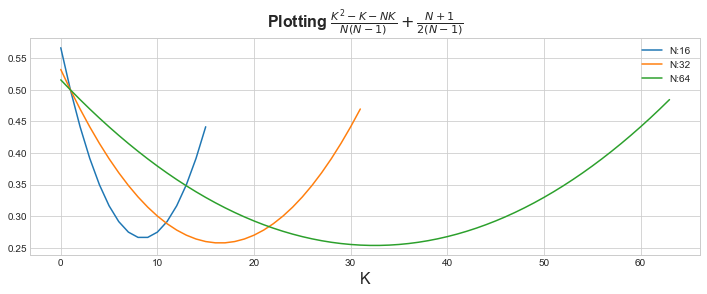
You can see it looks like a nice U shaped function. In Mathematics, we also call this as Convex function. The nice property of convex function is that they have one local minima or in simple words, there is one point where the function have the minimum value.
The second part of the equation \(\frac{N+1}{2(N-1)}\) is considered constant as it’s not dependent on value of K. We can see
that by plotting with and without the constant part for a given value of N. For example, for N=64, you can see the shape remains
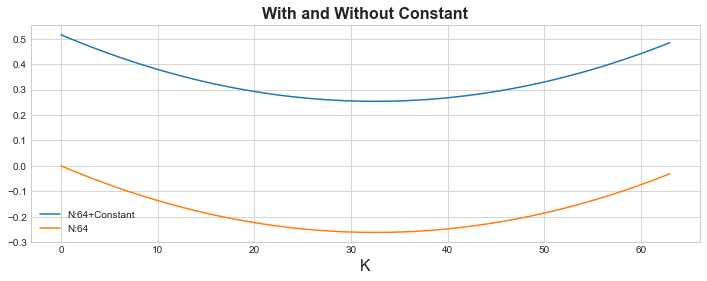
the same. All the constant part did was that it just added an offset. This basically shows you that if you find a value
of K where the function is minimized, it’s going to be the same for both. Which from the graph, you can tell its around K=30
for both parts.
We can go a bit further and drop the denominator \(\frac{K^{2} - K - NK}{N(N-1)}\) as it’s a constant as well and makes no difference to the shape or the minima of the function. It is still the same as evident by the below graph.
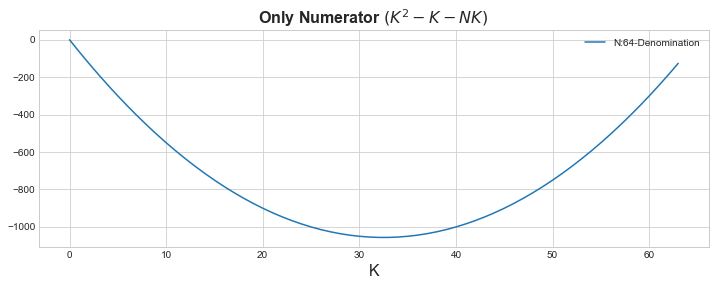
Now the way you want to find the minimum of a given function is where the slope is zero, i.e. Its not increasing or decreasing.In the below graph, it’s the orange point where the slope is zero.
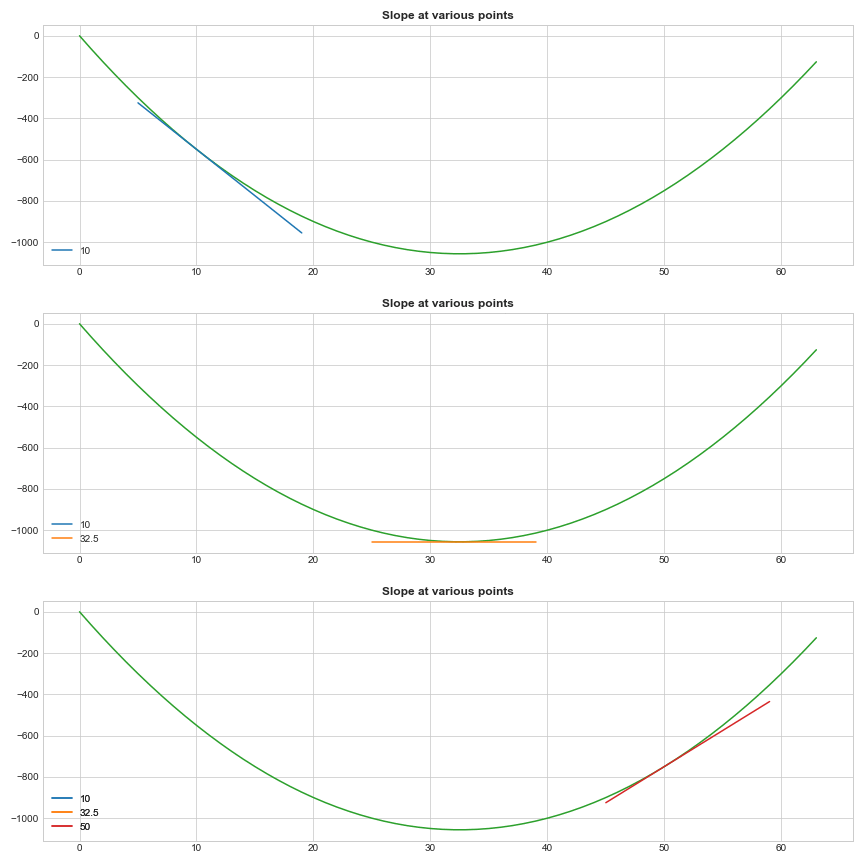
We all know that calculus is a study of change and we will differentiate the function to find the point where the slope is zero.
\[\begin{align*} \frac{\mathrm{d (K^{2} - K - NK)} }{\mathrm{d} K} = 0 => 2K - 1 - N = 0 => K = \frac{N+1}{2} \end{align*}\]This gives us the result for K where it’s minimum \(K = \frac{N+1}{2}\). If we plug this back into our original example,
where N=5, we get the value K=3 and if you recall that’s where we noticed the least disruption.
Conclusion
Based on the above results, RFC recommends to add new regions as new Next-Hops get’s added to the middle of the region. We can not control from where the Next-Hop get’s deleted but at least in this way we optimize what we can.