Back to Basics: A Primer on Communication Fundamentals
Motivation
In our rapidly advancing world, communication speeds are increasing at a fast pace. Transceiver speeds have evolved from 100G to 400G, 800G, and soon even 1.6T. Similarly, Optical systems are evolving to keep up with the pace. If we dig deeper, we will discover that many concepts are shared across various domains, such as Wi-Fi, optical communications, transceivers, etc. Still, without the necessary background, It’s not easy to identify the patterns. If we have the essential knowledge, it becomes easier to understand the developments happening in the respective areas, and we can better understand the trade-offs made by the designers while designing a particular system. And that’s the motivation behind writing this post is to cover fundamental concepts which form the basis for our modern communication system and how they all relate to each other.
Waves
So let’s start with the most fundamental thing, i.e., wave. A wave is a disturbance that carries energy from one location to another without displacing matter. Waves transfer energy from their source and do not cause any permanent displacement of matter in the medium they pass through. The following animation demonstrates this concept.
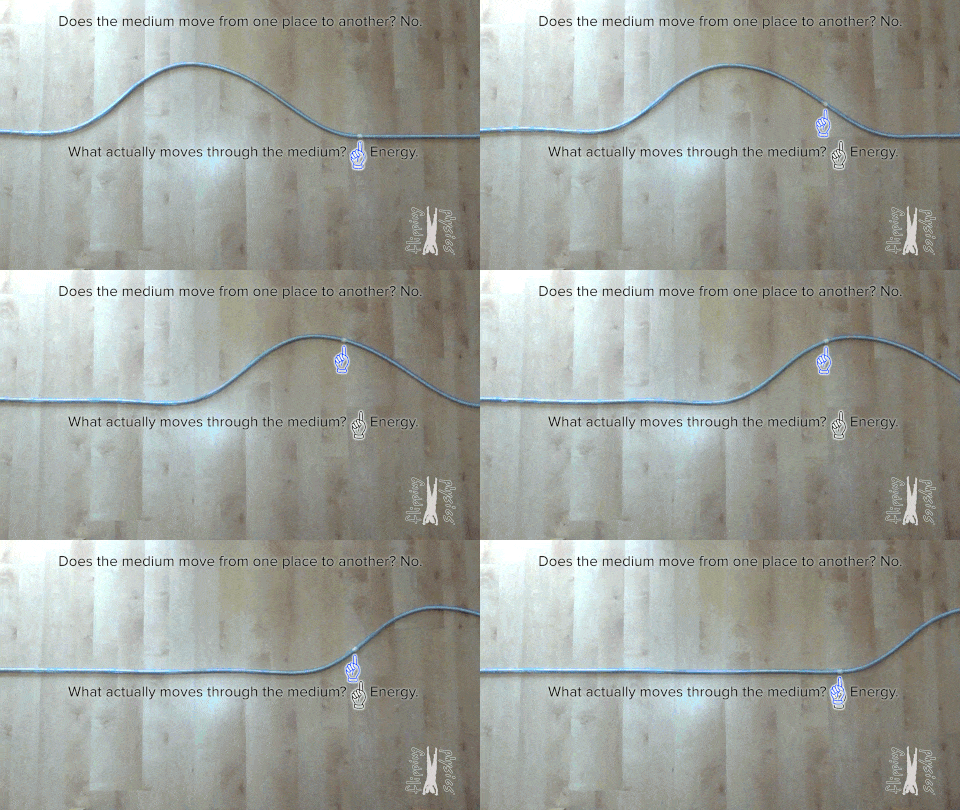
Ocean and sound waves are mechanical waves that require a medium to travel through, meaning they cannot propagate through a vacuum. On the other hand, electromagnetic waves do not require a medium to propagate and can travel through both vacuum and matter. Examples of electromagnetic waves include light, radio waves, and microwaves.
Some fundamental properties of Electro magnetic waves are:
Frequency and Period
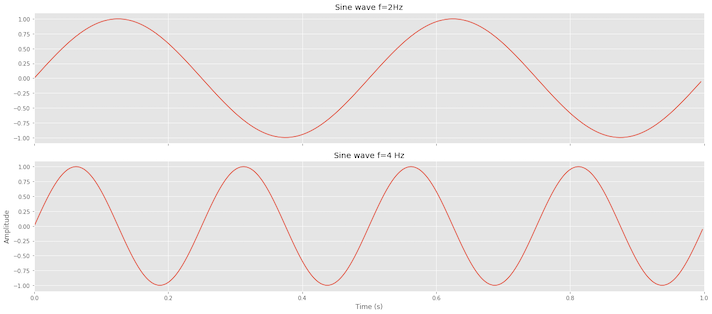
Frequency ($f$) describes the number of cycles per second of a wave. The unit of frequency is Hertz (Hz), and one hertz equals one cycle per second.
Period ($T$) is the time for a wave to complete one repetition. The relationship between Period and Frequency can be given as $T = \frac{1}{f}$.
If a wave has a frequency of 1 GigaHertz ($10^9$ Hz), it has $10^9$ cycles per second and the period, i.e., the time it takes to finish one repetition, is one nanosecond ($\frac{1}{10^9}$). The plot below displays two waves, the first oscillating at 2 Hz (i.e., two cycles per second) and the second at a frequency of 4 Hz (i.e., four cycles per second).
Amplitude
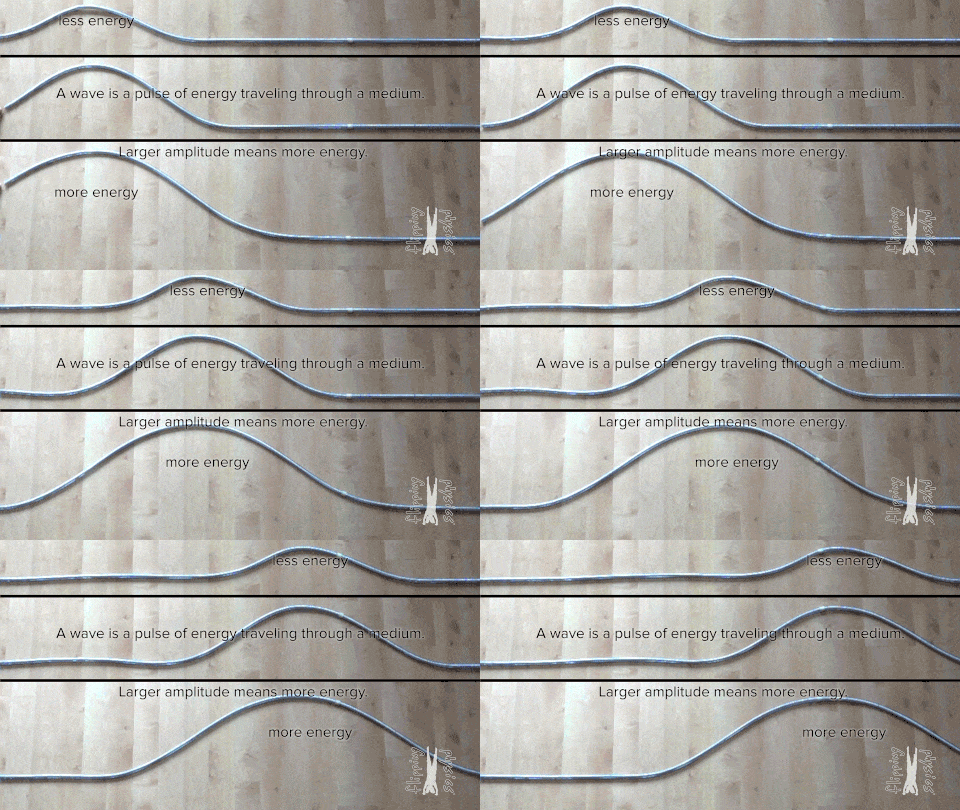
In the context of waves, amplitude denotes the highest signal strength level, typically expressed in Volts.
Wavelength
A wave’s wavelength ($\lambda$) is the distance between consecutive peaks measured in meters. If you look at the below picture, the wavelength of the Sine wave with less frequency is higher, and the wavelength for the higher frequency is shorter. This brings us to the relation that wavelength is inversely proportional to frequency.
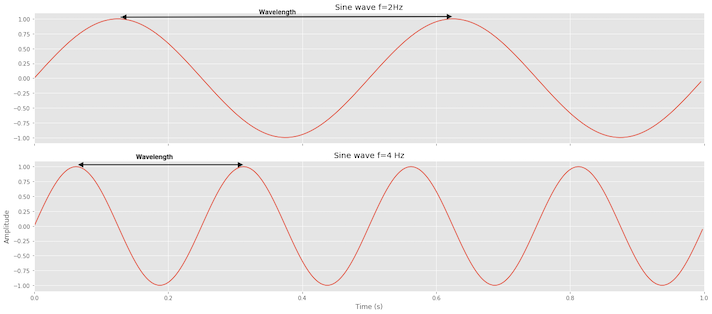
The relationship between wavelength, frequency and Velocity (the speed at which the wave propagates through a medium) can be expressed as $\lambda = \frac{v}{f}$. You can explore and interact with this simple animation to gain a better understanding, which will help you develop your intuition Wavelength and Wave Speed.
Phase
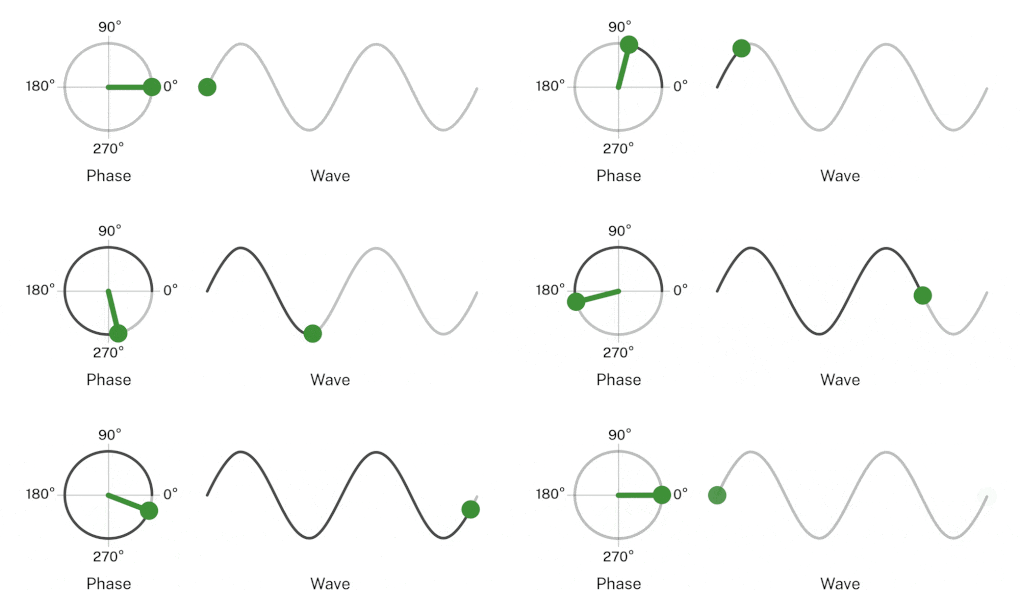
A phase refers to the particular point in the cycle of repeating waveform, measured as an angle in degrees or radians. One complete waveform cycle is $2\pi$ radians; the half cycle is $\pi$ radians. The concept of phase helps to describe a specific point within a given cycle of periodic waves. The diagram below illustrates the point:

The first wave cycle starts at point A, which has a phase angle of 0 radians and ends at point F which has the phase angle of $2\pi$ radians. The point B has a phase angle of $\frac{\pi}{2}$ radians. Points D and E have phase angles of $\pi$ radians and $\frac{2\pi}{3}$ radians, respectively.
Points on consecutive waves that occupy the same position in the wave cycle have the same phase angle. Points B and G have the same phase angle of $\frac{\pi}{2}$ radians. Here is a visualization that should illustrate the above point.
ref: https://www.nist.gov/image/phasegif
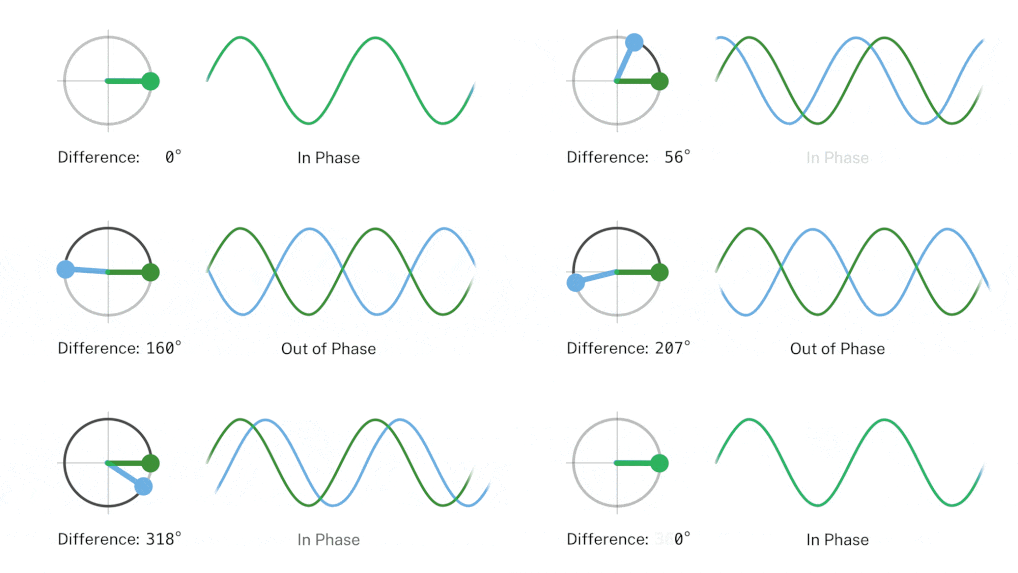
We are often interested in the phase difference between two waves. Two waves of the same frequency are said to be in phase if they have the same phase angle, and if different, then called out of phase.
ref: https://www.nist.gov/image/phase-differencegif
By convention, the phase difference between two waves of the same frequency is expressed as a value in the range $-\pi$ to $\pi$. This means the first wave can lead the second wave by anything up to $\pi$ radians when two signals differ in phase exactly by $-\frac{\pi}{2}$ or $\frac{\pi}{2}$ radians, they are said to be in Phase quadrature. When two signals differ in phase by exactly $\pi$ radians, they are said to be in phase opposition.
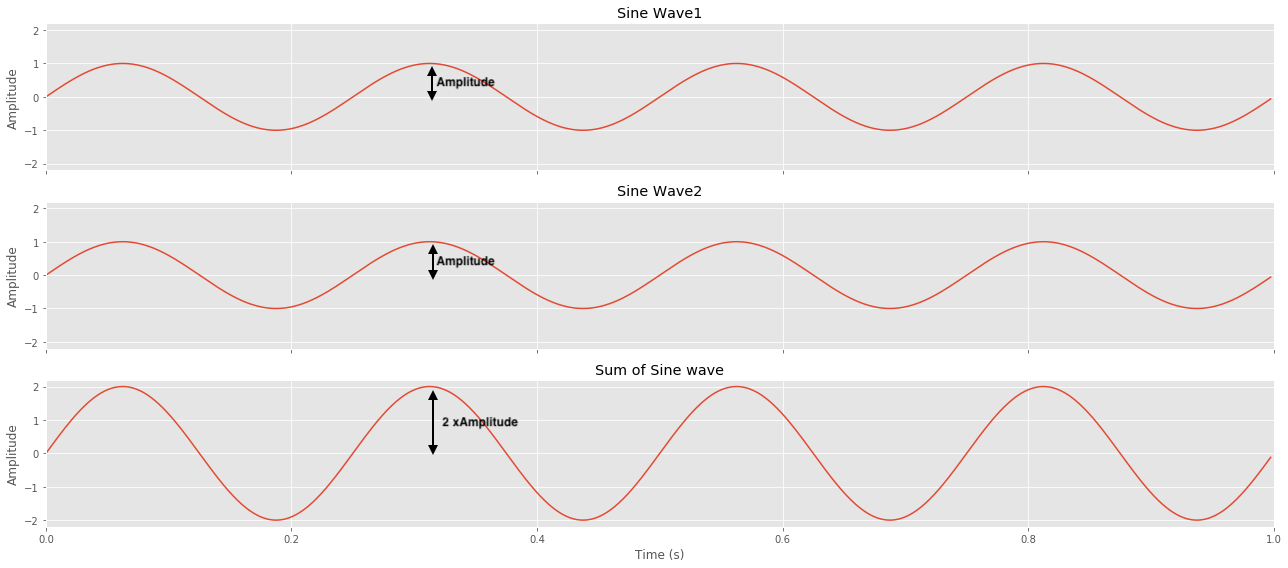
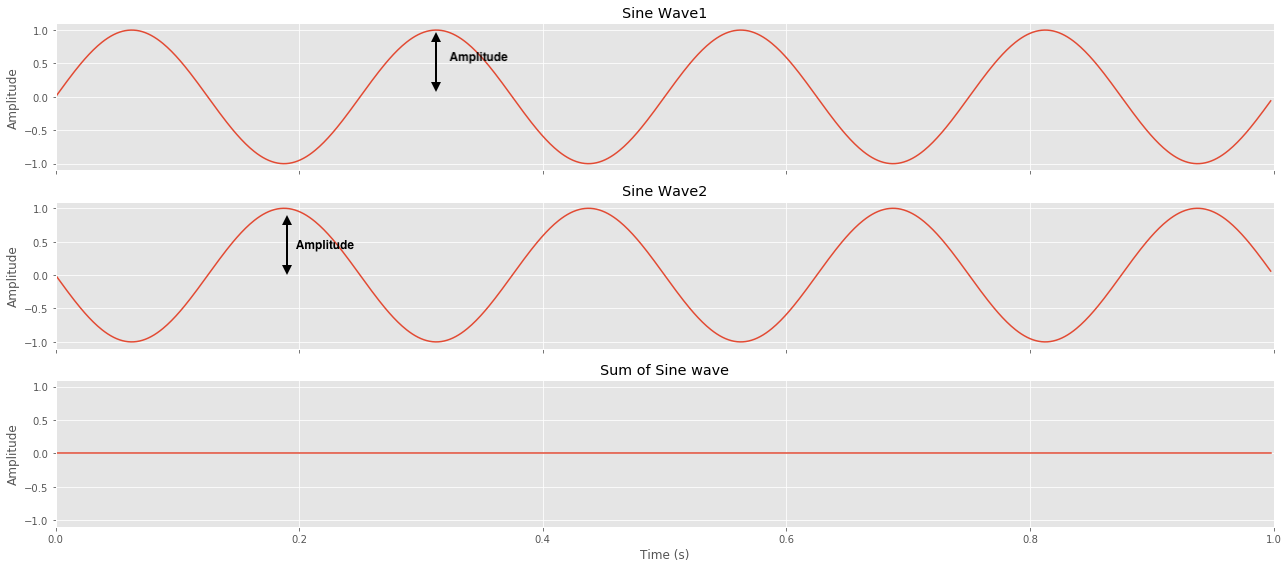
You can see how adding two sine waves in phase gives us a bigger sine wave, and if they are out of phase, they cancel out each other.
In Phase addition of sine waves:
Out of phase addition of two sine waves:
Sine Wave Representation
Having examined different properties of waves, such as frequency, wavelength, amplitude, and phase, we can now explore how we can represent a sine wave.
\[S(t) = A* Sin(2\pi*f*t+\phi)\]where, $A$ is the amplitude. $f$ is the frequency. t is the time. $\phi$ is the phase.
Composite Signals
Until now, our focus has been on individual waves and their respective properties. However, in reality, signals are composed of multiple waves with varying frequencies. For instance, When we combine two sine waves with odd frequencies, we observe the emergence of a wave with a Square like shape.
\[F(t) = 1*sin(2\pi*1*t) + \frac{1}{3}sin(2\pi*3*t)\]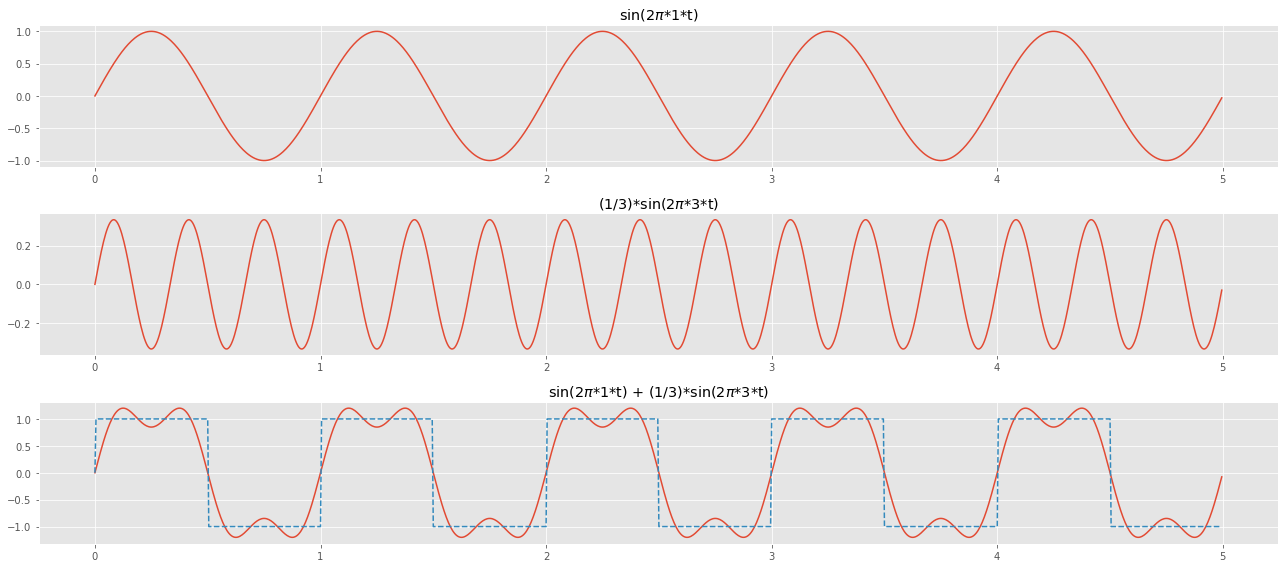
Frequency Domain
Thus far, all the signals we have encountered have existed in the time domain. As you may have observed, the diagrams we have examined featured an x-axis representing time. Conversely, the frequency domain illustrates the frequencies that constitute a signal along the x-axis, while their corresponding amplitudes are depicted on the y-axis.
We can use a frequency domain plot to demonstrate the relationship between amplitude and frequency, showing the peak value and the frequencies involved. The main advantage of frequency domain plots is that they allow us to identify a signal’s frequency and peak amplitude values instantaneously.
Below is the frequency domain plot for three signals:
1) A Sine wave with an amplitude = 1, frequency = 1 Hz and phase = 0. We can see in the frequency domain on the right-hand side it has one frequency of 1 Hz with an amplitude of 1. 2) A Sine wave with an amplitude = 2, frequency = 2 Hz and phase = 0. We can see in the frequency domain on the right-hand side it has one frequency of 2 Hz with an amplitude of 2. 3) A composite signal has two frequencies, f and 3f. We derived the frequency and amplitude of the signal. We can see in the frequency domain plot on the right-hand side; it has two frequencies of 1 Hz and 3 Hz with an amplitude of 1.27 ($\frac{4}{\pi}$) and 0.3 ($\frac{1}{3}$).
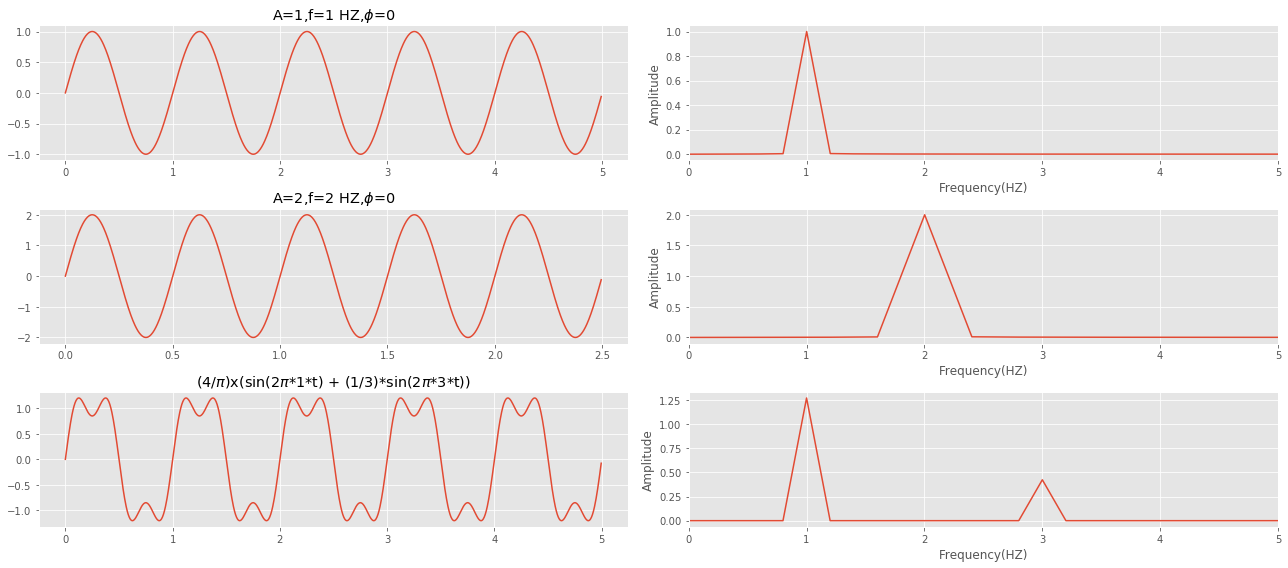
The usefulness of Frequency domain plots is that they provide a clear understanding of the composition of a given signal in terms of frequencies and their corresponding powers.
Fourier Transform
While we won’t delve into this topic in depth, it’s worth mentioning Fourier transform as it is relevant to our discussion. Jean-Baptiste Fourier, a French mathematician from the early 1900s, demonstrated that any complex signal can be represented as a combination of sine waves with varying frequencies, amplitudes, and phases.
The Fourier Transform allows us to convert a signal from time domain into frequency domain and display the frequencies present in the original signal. For example, consider a square-shaped wave composed of various signals with odd frequencies, which can be visualized through a frequency domain plot displaying the amplitude and frequencies of each signal.
Here is an illustration of a square-looking wave composed of various signals with odd frequencies and the frequency domain plot showing the amplitude and frequencies of the signals.
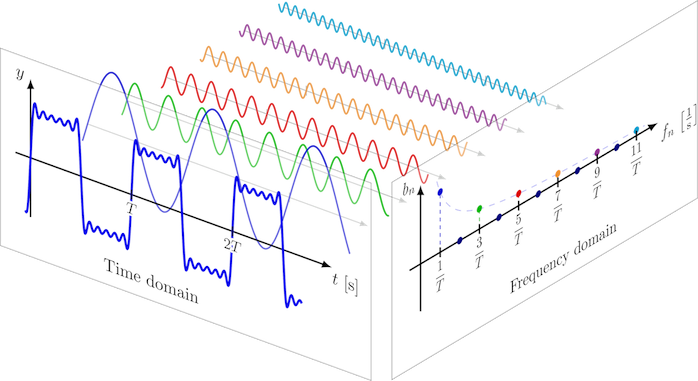
ref: https://tikz.net/fourier_series/
Another illustration of the fourier composition of square wave plotted in the frequency domain. As the signal becomes more square, the number of frequencies involved increases, as shown in the frequency domain.

ref: https://tikz.net/fourier_series/
A perfect square wave consists of infinite frequencies, which means in real life, there is no such thing as a perfect square wave. All square waves we observe in real life are approximations of a square wave.
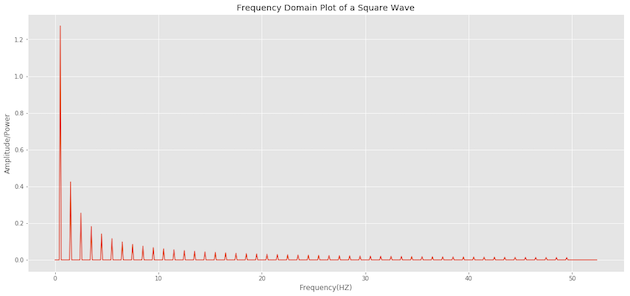
The below plot is another illustration that as we increase the number of components, the wave starts looking square. The bottom plot shows a signal comprising 50 composite signals, resulting in a wave with sharp edges closely resembling a square wave.
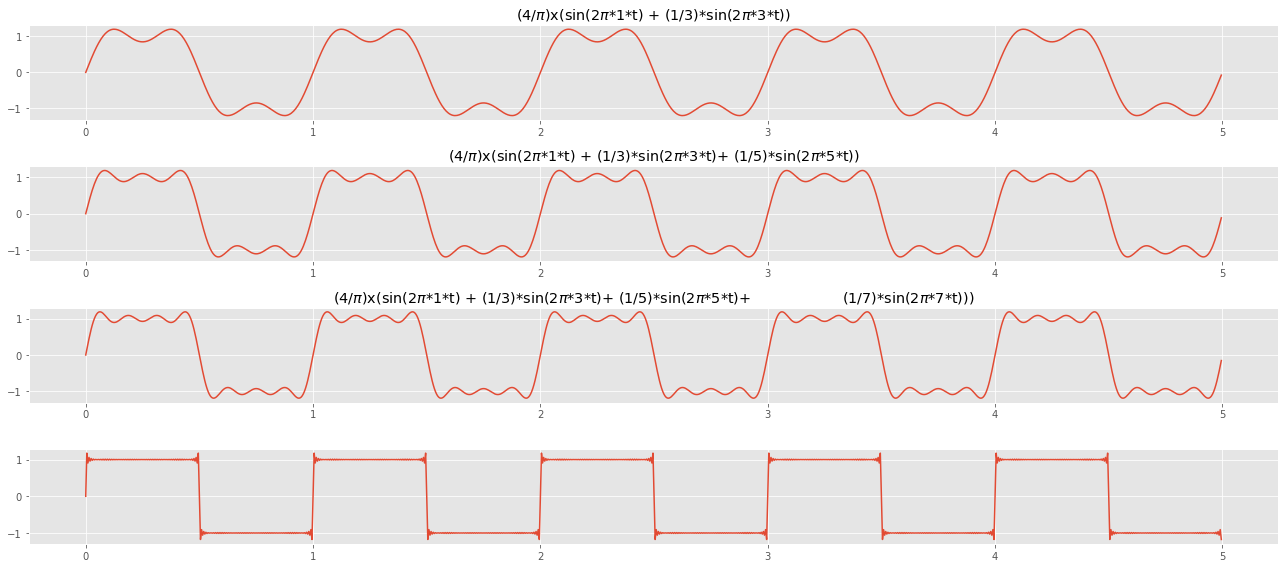
Applying Fast Fourier Transform on the above square wave, we can plot the frequency domain of the signal. We can observe the 50 frequencies and their respective amplitudes, which the square wave comprises.
It’s incredible how ubiquitous this idea is and the fields in which it gets applied. For example, folks with a background in statistics will use this a lot while doing Time Series analysis and may have familiarity with periodograms.
If this brief introduction piques your interest in learning about Fourier Transform, I highly recommend watching this video Fourier Transform Visual Introduction.
If you’re interested in a nugget of history on how famous statistician Tukey came up with an idea (Fast Fourier Transform) during President Kennedy’s science advisory committee meeting discussing ways to detect nuclear weapons tests in the Soviet Union. In that case, you will enjoy watching this video from Veritasium The Remarkable Story Behind The Most Important Algorithm Of All Time.
Bandwidth, Fundamental and Harmonic Frequency
In a signal, if all frequency components are integer multiples of one frequency, the latter frequency is referred to as Fundamental frequency. All other frequencies, which are multiples of the fundamental frequency, are called the Harmonic frequencies of the signal.
In the below example, the signal is made up of two sine waves with frequency $f$ and $3f$.
\[F(t) = 1*sin(2\pi*1f*t) + \frac{1}{3}sin(2\pi*3f*t)\]In this case, the fundamental frequency is $f$ and the spectrum i.e. the range of frequencies is from $f$ to $3f$. The absolute bandwidth of the signal which is the width of the spectrum is $3f - f = 2f$.
Plotting the above signal in time and frequency domain, we can see the two frequencies of $1f$ and $3f$ with a bandwidth of 2f (3f - 2f).

Relationship between Bandwidth in Frequency domain and BitRate
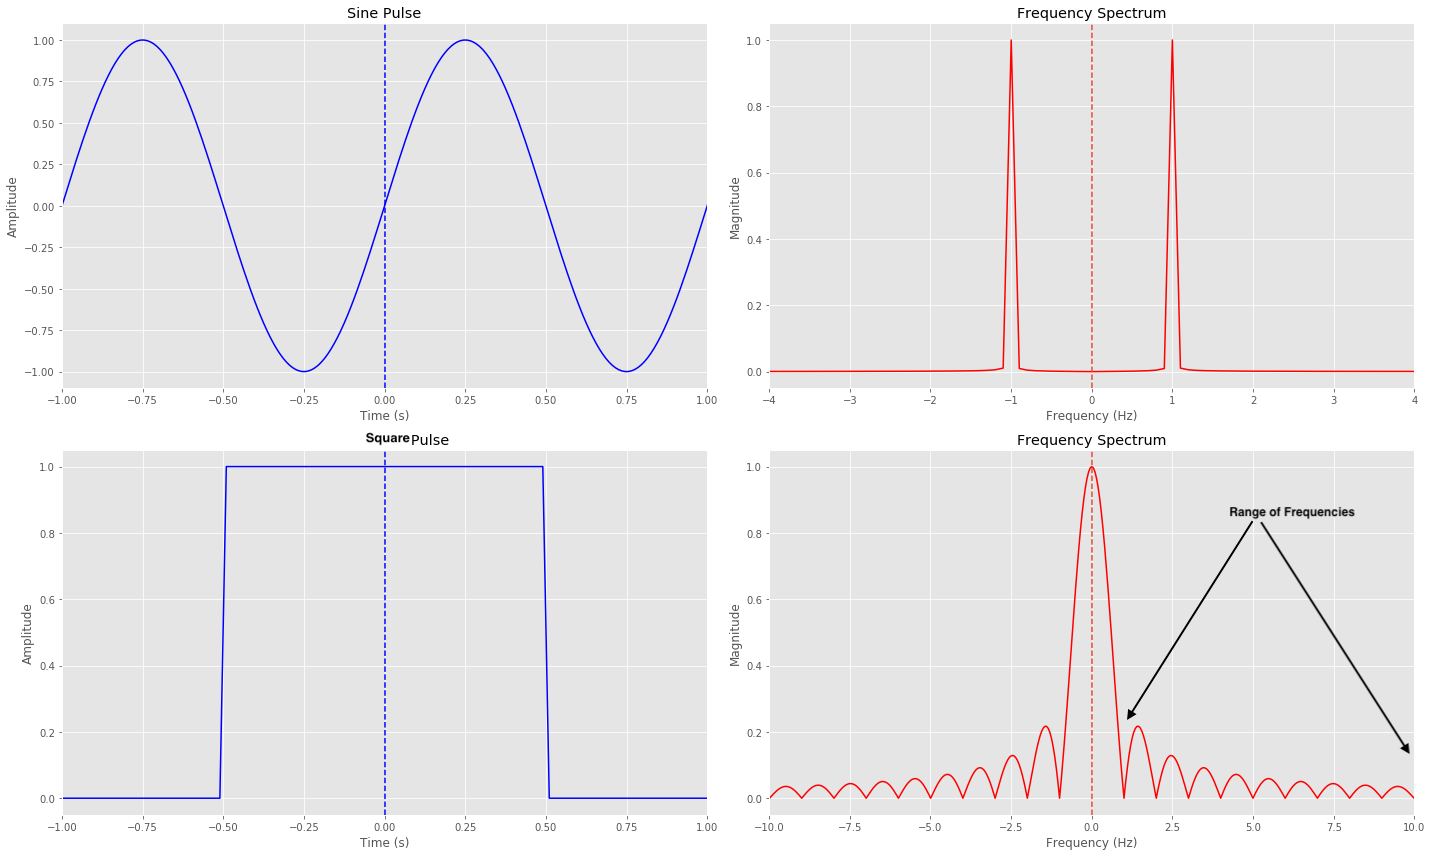
If we compare a Sine and a Square Pulse, we can see a single Sine Pulse has a single frequency component. The below plot shows both +ve and -ve of the spectrum. For the Square pulse, we already mentioned that it is a sum of many frequencies and we can see the decomposition of a square pulse which consists of many frequencies.
We measure the width of the square pulse in seconds, and we call it as the bit time, denoted as $T_b$. In the below plot for Square pulse, we have a pulse width of 1 second.
On the right side, we have the plot showing the range of frequencies that make up this sqaure pulse. These frequencies represent different components of the signal.
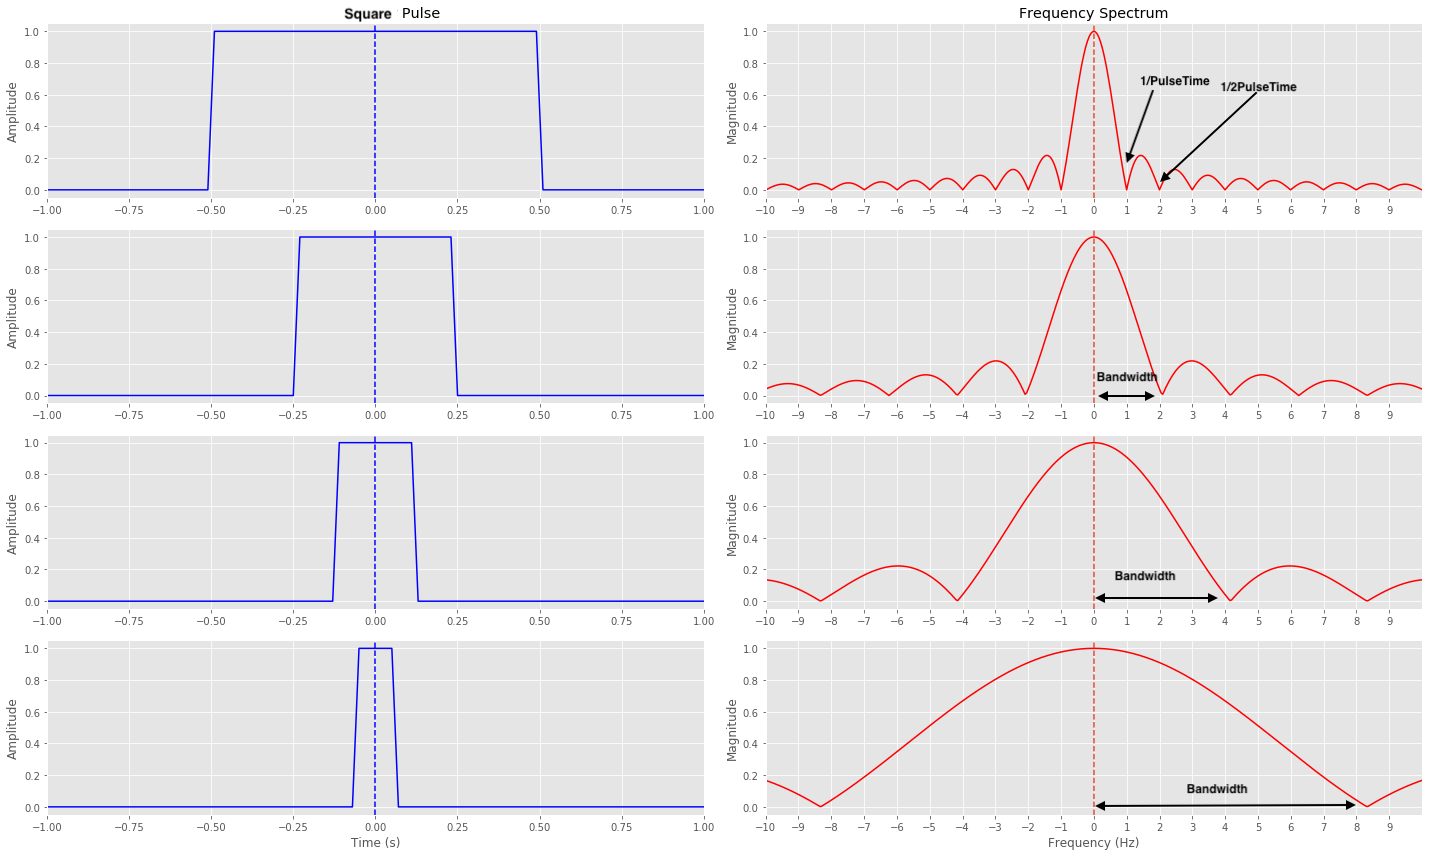
Now, let’s explore what happens when we decrease the pulse width. In the second subplot, we have a pulse with a width of 0.5 seconds. Notice how the width (bandwidth) of each frequency component in the frequency plot gets broader compared to the previous pulse, meaning in the frequency domain, it’s occupying more bandwidth. As the pulse width decreases, it becomes broader. We continue this trend in the third and fourth subplots, where the pulse widths are 0.25 and 0.125 seconds, respectively. As the pulse width decreases further, the range of frequencies involved gets wider.
Considering it carefully, the connection between pulse width and frequency bandwidth is intuitive. When the pulse width is shorter, we can accommodate more pulses within the same time period. This allows us to transmit more data in a given timeframe, thereby increasing the bandwidth in terms of data rate. Similarly, we can observe that as the pulse width decreases, the occupied bandwidth in the frequency domain also increases.
A Brief intro to Decibels (DB)
Before we proceed, it’s essential to clarify the concept of decibels, as we will be referring to them in the subsequent discussion.
Signal strength plays a crucial role in any transmission system. As a signal travels through a transmission medium, it experiences a decrease in strength called attenuation or loss. Decibels are a commonly used unit to express gains, losses, and relative levels of signals for two reasons:
- Signal strength typically decreases exponentially, and representing these losses in decibels, which are logarithmic units, makes it easier to understand and work with.
- Using decibels, we can add or subtract gains or losses in a series of transmission paths to determine the overall net gain or loss.
The decibel gain is given by
\[G_{dB} =10* log_{10}(\frac{P_{out}}{P_{in}})\]$G_{dB}$ = gain,in decibels $P_{in}$ = input power level $P_{out}$ = output power level
When we talk about decibel values, we refer to the relative magnitudes or changes in magnitude rather than an absolute level. However, Decibels can also be used to express an absolute value. In this situation, the number of decibels represents the ratio between a value and a specific fixed reference value. To indicate the reference value, we usually add a suffix to the decibel symbol (dB). For example, when we specify signal power, we often use a reference value of 1 milliwatt, and in such cases, the suffix “m” is added to the decibel symbol.
A signal power of 100 milliwatts could be expressed as:
\[10 * log_{10}(\frac{100}{1mW}) = 20 dBm\]Transmission Impairments
Attenuation
Attenuation means loss of energy. When a signal travels through a medium, it loses some of its energy in overcoming the resistance of the medium which is converted to heat. To compensate the loss, amplifiers are used to amplify the signal.
Distortion
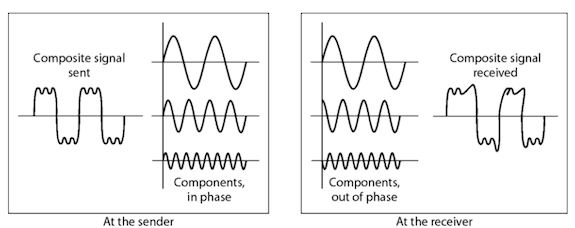
Distortion means that signal changes its form or shape. Distortion can occure in a composite signal made of different frequencies. Each signal component has its own propagation speed and therefore its own delay in arriving at the final destination. Differences in delay may create a difference in phase, means signal components at the receiver have phases different from they had at the sender.
Noise
There are several types of noise: Thermal noise, Intermodulatuon noise, Crosstalk and Impulse noise.
Thermal noise is the random motion of electrons in a wire which creates an extra signal. It is uniformly distributed across the bandwidths used in communication systems and is also known as white noise. It sets an upper limit on system performance.
The amount of thermal noise in a given bandwidth is determined by the formula for noise power, which is given by $N = k * T * B$.
where:
- N is the noise power in watts,
- k is the Boltzmann constant (approximately $1.38 * 10^{-23}$ J/K ),
- T is the temperature in Kelvin,
- B is the bandwidth in hertz.
In the case of a bandwidth of 1 Hz, the formula simplifies to: $N = k * T$.
The above equation tells us that the amount of noise power is directly linked to temperature. When the temperature rises, the thermal noise also increases. We often express thermal noise using noise power spectral density ($N_{0}$), representing the amount of noise power per unit bandwidth. In this particular scenario, when the bandwidth is 1 Hz, the formula simplifies to: $N_{0} = k * T$.
The noise power spectral density ($N_{0}$) concept helps us understand and measure the noise in electronic systems. It provides a way to evaluate and compare the noise performance of different systems, and we will reencounter this concept in our discussions.
Intermodulation noise occurs when multiple signals with different frequencies are transmitted through the same medium. This leads to the creation of additional signals that are the sum or difference of the original frequencies.
Crosstalk, on the other hand, happens when there is unwanted coupling between different channels. It occurs when signals leak or interfere with each other, causing disturbances. The noise types we discussed earlier, such as intermodulation noise and crosstalk, have relatively stable and predictable magnitudes. This predictability allows for designing transmission systems to handle and mitigate them effectively.
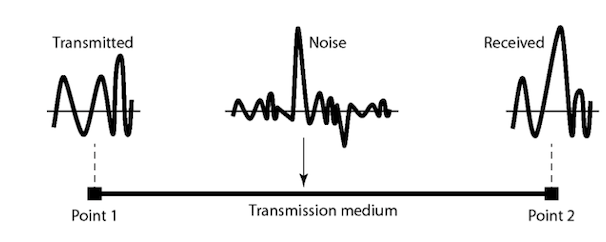
In contrast, impulse noise is quite different. It is irregular and non-continuous, appearing as sudden bursts or high amplitude spikes but short duration. Impulse noise is more challenging to handle because of its unpredictable nature.
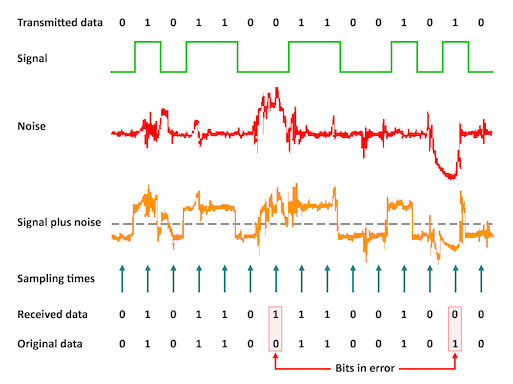
The following is an instance of transmitted data accompanied by noise. When noise interferes with the received signal, it can cause errors. In this scenario, the receiver misinterpreted 1 as 0 and 0 as 1, illustrating how noise can distort the signal.
Fundamental Laws and Principles of Modern Communications
HighWay Analogy
Before we dive into more concepts, let’s explore an analogy that can help us understand how everything fits together. This analogy will provide a mental model of where each concept comes into play and how they relate to each other.
Imagine a highway with multiple lanes, each lane having a different width. These lanes represent the allocated bandwidth for signals. Organization like International Telecommunication Union (ITU) sets the rule and assigns specific lanes and widths, determining how much space each signal can occupy.
In our analogy, let’s consider a truck representing the signal. Ideally, we want the truck’s width to match the lane’s width, ensuring that the signal fills the allocated bandwidth efficiently. However, we also want to leave some space, known as guard bands, between the lanes to prevent collisions and interference.

ref: http://complextoreal.com/tutorials/
So, our goal is to transport the signal smoothly by fitting it within the allocated bandwidth, just like a truck fitting within its designated lane on the highway, while also maintaining guard bands to ensure signal integrity.
Another important aspect is the road quality, which relates to the amount of noise encountered. If the road is rough, it can cause damage to our cargo or result in errors. Conversely, if the road is smooth, our cargo remains undamaged, and we reach our destination successfully.
Efficiently packing our cargo on the truck is another consideration. Ideally we want to carry as much cargo as we can without noise knocking the cargo down or too much power to carry the cargo. We will learn soon about the Nyquist theorem that helps us determine how much we can carry. If we do smart packing it will allow us to transport more cargo. If we stack our cargo high, we will carry more but we must ensure that noise doesn’t knock down the whole pile. The stacking of the cargo technique is equivalent to increasing the number of bits we can transmit but we must make sure error rate is mangable. We will see this concept with Multi-level bit signaling where a signal represents more bits.
The size of the truck engine represents the carrier power. In a multi-level shipping scenario, a higher-power engine is typically required. The power-to-noise ratio is expressed as the Signal-to-Noise Ratio (SNR), influencing performance.
By considering these four parameters of a channel - bandwidth, multi-level bit signaling, noise, and power - we can discuss the channel’s capacity and how effectively it can transmit information.
Nyquist theorem and Shannon’s Law
In the twentieth century, several scientists and engineers made essential contributions to the development of modern communication. Three key figures were Ralph Hartley, Harry Nyquist, and Claud Shannon. Their work and ideas were crucial in establishing the fundamental laws and principles we rely on in communication today.
In 1927 Harry Nyquist, came up with this renowned formula which states that the bit rate(BR) is restricted by the transmission link bandwidth (BW). It noted that the bit rate can not exceed twice the transmission link bandwidth.
\[\hspace{5cm} BR \le 2*BW\]Later the above was further developed by Ralph Hartley to the multilevel binary coding.It said that the bit-rate is
\[\hspace{5cm} R = 2*BW*log_{2}L\]where $L$ is the number of discrete levels carrying information. If we subsitutde bitrate ($R$) with maximum channel capacity ($C$), we obtain
\[\hspace{5cm} C = 2*BW*log_{2}L\]The above is also known was Hartley’s capacity law, and it helps in determining the transmitting capacity of a channel, depending on its bandwidth. However, it does not take into account the influence of noise. It was Claude Shannon, who further developed this idea and came up wth his famous formula:
\[\hspace{5cm} C = BW * log_2(1 + SNR)\]where $C$ is the maximum transmission rate that a communication channel can reliabily provie, $BW(HZ)$ is the available channel bandwidth and SNR is the signal to noise ratio.
Shannon’s law is often referred to as Shannon’s limit because it says that an actual transmission rate should not exceed channel capacity to support error free transmission.
SNR is defined as the ratio of signal’s power to noise’s power i.e.
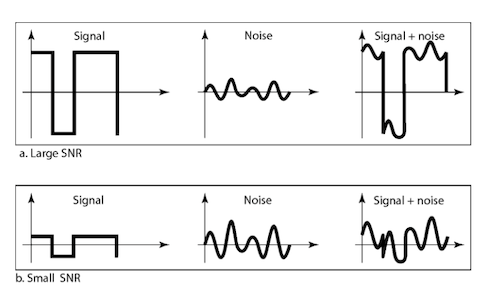
\[\hspace{5cm} SNR = \frac{P_{s}(W)}{P_{n}(W)}\]A high SNR means the signal is less corrupted by noise and Low SNR means the signal more corrupted by noise.
SNR is described in decibel units $SNR_{dB} = 10*log_{10}$ SNR.
We can see the effects of large and small SNR on the receiver side.
Data Rate Limits
A very important consideration in data communications is how fast we can send data, in bits per second, over a channel. Data rate depends on three factors:
- The bandwidth available.
- The level of the signals we use.
- The quality of the channel (the level of noise).
Noiseless Channel: Nyquist Bit Rate
\[\hspace{5cm} Bit Rate = 2 * B * log_{2}L\]Where B is the bandwidth of the channel. The number of signal levels (L) refers to the different levels that can be used to represent data. The bit rate is the speed at which bits are transmitted, measured in bits per second.
One approach to achieve a higher bit rate is to increase the number of signal levels used. This means a higher BitRate at the same bandwidth as increased signal levels represent more bits. However, it’s important to note that there is a practical limit to how many signal levels can be effectively used. Increasing the signal levels comes with a trade-off. As the number of levels increases, the system’s reliability may decrease. This is because it becomes more challenging for the receiver to distinguish between the different levels accurately. The probability of errors occurring in the transmission increases as a result.
Therefore, while theoretically, achieving any desired bit rate by increasing the number of signal levels is possible, there is a practical limitation due to the potential decrease in reliability. The receiver must be highly sophisticated to interpret the signals and minimize errors correctly.
Noisy Channel: Shannon Capacity Law
\[\hspace{5cm} Capacity = B * log_{2}(1+SNR)\]In reality, it’s not possible to have a completely noise-free channel for communication. Shannon’s law provides a way to determine the maximum capacity of a transmission system by $C = BW * log_2(1 + SNR)$, where C represents the channel capacity, BW is the bandwidth, and SNR is the signal-to-noise ratio.
It’s important to note that Shannon’s law describes a characteristic of the channel itself, not the specific transmission method. Consider an extremely noisy channel in which the value of the signal-to-noise ratio is almost zero. In other words, the noise is so strong that the signal is faint. This means that the capacity of this channel is zero regardless of the bandwidth. In other words, we cannot receive any data through this channel.
\[\hspace{5cm} C = B*log_{2}(1+SNR) = B* log_{2}(1+0) = B*log_{2}(1) = B * 0 = 0\]The signal-to-noise ratio is often given in decibels and can be calculated as:
\[\hspace{5cm} SNR_{dB} = 10*log_{10}(SNR)\]where SNR is calculated by
\[\hspace{5cm} SNR = \frac{P_{s}}{P_{n}}\]For example, if we have a channel with a 1 MHz bandwidth and SNR for this channel is 63, we can calcuate the appropriate bit rate and signal level. First, we use the Shannon formula to find the upper limit.
\[\hspace{5cm} C = B*log_{2}(1+SNR) = 10^6*log_{2}(1+63) = 10^6*log_{2}64 = 6Mbps\]The Shannon formula gives us an upper limit of 6 Mbps (megabits per second) for the transmission capacity. However, we might choose a lower rate, such as 4 Mbps, for improved performance. Once we have determined the desired bit rate, we can use the Nyquist formula to calculate the signal levels needed for the transmission.
\[\hspace{5cm} 4Mbps = 2 * 1 MHz * log_{2} L = 4\]We observed that the Shannon capacity gives us the upper capacity limit; the Nyquist formula tells us how many signal levels we need.
Bit and Baud Rate
Let’s break down the difference between bit rate and baud rate:
- Bit rate: This represents the total number of bits transmitted per second. It tells us how many individual bits are being sent in a given time period.
- Baud rate: This refers to the number of symbols sent per second. A symbol is a unit that represents a specific piece of information, such as a voltage change on a transmission line. The number of bits each symbol represents depends on the encoding scheme used.
In baseband signaling, symbols are commonly represented by voltage changes. Each symbol can represent a single bit when a transmission uses only two signaling levels (like high and low voltages). In this case, the baud rate equals the bit rate because each symbol corresponds to one bit.
To better understand this, let’s look at an example: Suppose we send 10 symbols per second. On the left side, if each symbol represents one bit, the bit rate and baud rate would be 10 bits per second. On the right side, if each symbol represents two bits, then the bit rate would be 20 bits per second, while the baud rate would still be ten symbols per second.
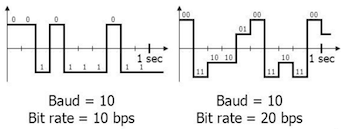
The relationship between symbols and the number of bits depends on the encoding scheme. When each symbol represents one bit, the bit rate and baud rate are the same. But when each symbol represents multiple bits, the bit rate is higher than the baud rate.
To send the required number of bits per symbol, we need a transmitter capable of generating the necessary number of symbols at different voltage levels or waveforms. We also need a receiver sensitive enough to differentiate between those symbols.
NRZ, also called PAM-2, is the encoding type where the bit rate and symbol rate are the same. In PAM-4 encoding scheme, we double the bit rate for the same symbol rate by encoding two bits per level and having four levels.
Power Efficiency: $E_{b}/N_0{}$
One of the goals in designing a communication system is to send information reliably using the lowest practical power level, aka power efficient. $\frac{E_{b}}{N_{0}}$ is a metric to measure the efficiency of a communication system in terms of how much power is required to achieve a certain level of signal quality. In simple terms, $\frac{E_{b}}{N_{0}}$ represents the ratio of the energy per bit ($E_{b}$) to the power spectral density of the noise ($N_{o}$) in the communication channel. It indicates the signal’s strength relative to the background noise level.
Power efficiency is important because it helps evaluate the performance and effectiveness of a communication system. A higher $\frac{E_{b}}{N_{0}}$ value indicates that the system can achieve better signal quality (lower error rate) using less power. Conversely, a lower $\frac{E_{b}}{N_{0}}$ value means that more power is required to maintain a reliable communication link.
As the bit rate $R$ increases, the transmitted signal power, relative to the noise, needs to increase to maintain the required $\frac{E_{b}}{N_{0}}$. As the data rate increases, there is a need to increase the signal power to maintain the same power efficiency.
The error rate also increases when the data rate increases. To understand why, let’s consider the scenario where we double the data rate. In this case, the bits are packed closer together within each symbol. As a result, the same amount of noise in the transmission medium can potentially affect and corrupt two bits instead of just one.To visualize this, let’s refer to the plot we saw earlier, where we currently have a single bit per symbol. Now, imagine that we switch to sending two bits per symbol. In this situation, the same noise in the transmission medium would now distort two bits within a single symbol, leading to a higher likelihood of errors occurring.

Spectral Efficiency
Spectral efficiency, or bandwidth efficiency, refers to how effectively we can transmit data within a given bandwidth. It measures the number of bits we can send per second for each hertz of available bandwidth.
The goal is to maximize the data we can transmit using the least bandwidth possible. Spectral efficiency allows us to compare different transmission schemes and determine which is more efficient in utilizing the available spectrum for data transmission. A higher spectral efficiency means that more data can be transmitted in a given bandwidth, allowing for higher data rates or accommodating more users within the same frequency spectrum.
If we refactor the shannon’s equation, we can get the theoretical maximum spectral efficiency using Equation
\[\hspace{5cm} \frac{C}{B} = log_2(1+SNR)\]$\frac{C}{B}$ has the dimensions $bps/Hz$.
Spectral and power efficiency ($\frac{E_{b}}{N_{0}}$) are intertwined. While spectral efficiency focuses on optimizing the frequency spectrum, power efficiency is concerned with optimizing the use of power to achieve reliable communication.
A higher spectral efficiency often requires more complex modulation schemes or signal processing techniques that can transmit more bits per symbol. These sophisticated modulation schemes may require higher signal power to maintain a reliable communication link, resulting in lower power efficiency (higher $\frac{E_{b}}{N_{0}}$).
Conversely, a lower spectral efficiency, such as using simpler modulation schemes with fewer bits per symbol, may require less signal power for reliable communication, leading to higher power efficiency (lower $\frac{E_{b}}{N_{0}}$).
Therefore, there is a trade-off between spectral efficiency and power efficiency. As spectral efficiency increases, the data capacity improves, but it may require more power to maintain reliable communication. On the other hand, lower spectral efficiency may consume less power but provide lower data rates. We will see these tradeoffs as we compare various PAM modulations later.
Line Encoding Technique
Transmitters use line encoding techniques to convert binary data into a form that can be transmitted over a communication line. The receiver then converts this encoded signal back into binary data.
For wired channels, voltage manipulation is used to generate electrical pulses representing the data. In the case of optical channels, the intensity of light pulses is modulated. When selecting an encoding technique, we desire certain properties like:
-
Minimal Complexity: We aim to keep the encoding scheme as simple as possible to reduce the cost and complexity of the transmitter hardware.
-
Bandwidth Limitation: The encoding scheme should allow for the maximum data signaling rate on a channel with limited bandwidth.
-
Spectral Efficiency: This refers to how efficiently the modulation scheme utilizes the available bandwidth. Comparing the power spectral density plots can show how power is distributed across different frequencies for each modulation scheme. A more spectrally efficient scheme concentrates power in a narrower bandwidth.
-
Power Efficiency: The transmitted signal power should be as low as possible while still achieving the desired data rate and an acceptable error probability. This ensures efficient use of power and minimizes electromagnetic noise on the transmission line.
There are various encoding schemes available, but we will focus on one commonly known: the Non-Return-to-Zero (NRZ) encoding scheme.
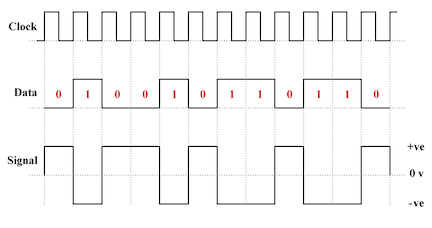
Polar NRZ-Level
Polar line coding schemes use both positive and negative voltage levels to represent binary values. Here, the voltage level determines the value of a bit. Typically,logic low(binary zero) is represented by a positive voltage while logic high(binary one) is represented by a negative voltage.
Multi-Level Modulation
The main idea behind multilevel modulation formats is packing several (preferably, many) bits into one symbol (pulse) and transmitting these symbols instead of individual bits through a communication system. Instead of sending individual bits one by one, we can group them together and send symbols that represent combinations of these bits. For example, in a two-level modulation system, we have two symbols: one symbol represents a 0 bit, and the other symbol represents a 1 bit. However, in a four-level modulation system, we can have four symbols that represent four different combinations of two bits: 00, 01, 10, and 11.
By using multilevel modulation, we can save bandwidth and increase the efficiency of transmission. Let’s compare a two-level system and a four-level system that both transmit 16 bits in one second. In the two-level system, we need to send 16 pulses to transmit all the bits, while the four-level system only requires eight symbols. This means that the four-level modulation needs half the bandwidth of the two-level modulation. The reason is that the duration of a symbol in the four-level system is twice that of a bit, resulting in a narrower bandwidth for the pulses.
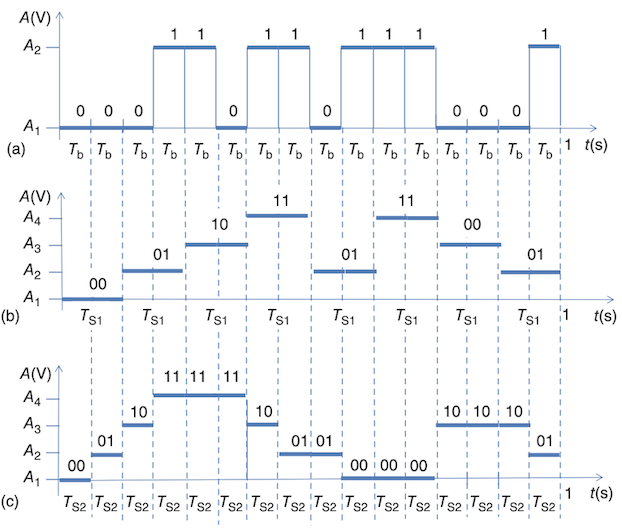
Let’s use an example to explain this. In the section (a) of below Figure, we have a two-level modulation (On-Off) where a pulse with amplitude A1 represents bit 0 and a pulse with amplitude A2 represents bit 1. We use a four-level modulation in the section (b) and (c) of below. In this case, the pulse with amplitude A1 represents the combination of bits 00. Similarly, pulse A2 represents the combination of bits 01, pulse A3 represents 10, and pulse A4 represents 11. So instead of having just two levels for representing 01, we use four levels to describe four combinations of bits: 00, 01, 10, and 11. This type of modulation is called four-level modulation.
Now, if we compare section (a) and (b), two and four-level modulations deliver 16 bits per second, so their bit rates are the same. However the number of pulses required to transmit these 16 bits is different. The two-level modulation requires 16 pulses, while the four-level modulation only needs eight. If we observe closely, the duration of each pulse (bit time) is longer for the four-level modulation than the two-level modulation( $T_{b}$ and $T_{s1}$).
Recall that a longer bit time means a narrower pulse bandwidth, as we learned from the spectrum of a square pulse. This implies that the four-level modulation saves bandwidth in transmitting its signals.
In section (c) of Figure, we see another version of four-level signaling. The bit time is the same as in section (a) and (c), but the four-level modulation can deliver 32 bits per second instead of just 16 bits per second. This means the four-level modulation can achieve a higher bit rate without additional bandwidth required to transmit a signal.
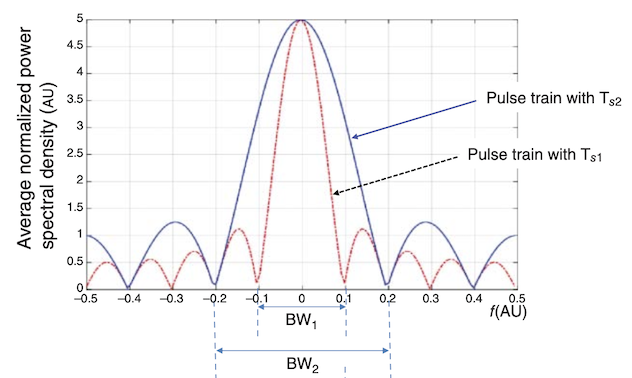
In general, multilevel modulation offers the advantage of either saving bandwidth without sacrificing the bit rate or increasing the bit rate without requiring more bandwidth.
The efficiency of multilevel modulation is measured by spectral efficiency($SE$), which compares the bit rate to the bandwidth. A higher number of levels (symbols) in the modulation increases the spectral efficiency. So, the greater the number of levels, the higher the efficiency in achieving maximum bit rate with minimum transmission bandwidth.
If we recall, that $\frac{BitRate(b/s)}{Bandwidth(Hz)}= SE(b/s/Hz)$. We also know from the Nyquist bit rate $Bit Rate = 2 * Bandwidth * log_{2}L$. Combing the two we can get spectral efficiency as $SE(b/s/Hz) = 2 * log_{2}L$. From this we can use to calculate the sptrecal efficiency for our examples. The spectral efficiency($SE$) for the two level signalling will be 2 (b/s/Hz) and four level signalling will be 4 (b/s/Hz).
In general, higher the multilevel modulation greater the spectral efficiency(SE). Multilevel modulation techniques, such as pulse amplitude modulation (PAM), use different amplitudes of pulses to represent symbols. A two-level modulation is known as PAM2, while a four-level modulation is called PAM4.
Power Spectral Density Plots for comparison
Before we compare various PAM schemes using PSD plots, it’s essential to understand how to read and infer the information from them. When comparing power spectral density (PSD) plots of different modulation schemes, there are a few factors to consider:
-
Spectral Efficiency: Spectral efficiency refers to how efficiently the modulation scheme utilizes the available bandwidth. Comparing the PSD plots can give you an idea of how the power is distributed across different frequencies for each modulation scheme. A modulation scheme that concentrates power in a narrower bandwidth is considered more spectrally efficient.
-
Bandwidth Occupation: The width of the power distribution in the PSD plot indicates the bandwidth occupied by the signal. Comparing the bandwidths of different modulation schemes can help you understand their spectral efficiency and the potential for interference with neighboring signals.
-
Signal-to-Noise Ratio (SNR): The PSD plot can provide insights into the signal-to-noise ratio characteristics of different modulation schemes. A higher peak power level in the PSD plot suggests a higher signal power, which can be beneficial for better SNR and improved performance in the presence of noise.
-
Symbol Rate: The symbol rate, or the rate at which symbols are transmitted, can be inferred from the PSD plot. The spacing between significant power levels or peaks in the plot can provide an indication of the symbol rate. Comparing the symbol rates of different modulation schemes can help you assess their data transmission capabilities.
By analyzing these factors in the PSD plots of different modulation schemes, we can gain insights into their spectral characteristics, bandwidth utilization, signal quality, and potential for interference. It allows you to compare and evaluate the performance and suitability of different modulation schemes for specific applications or system requirements.
Pam Modulation comparison
Let’s do a comparison of various PAM modulation like PAM2 (NRZ), PAM4 (4 levels). The factors to consider while comparison should include data rate, spectral efficiency, complexity, Noise tolerance etc.
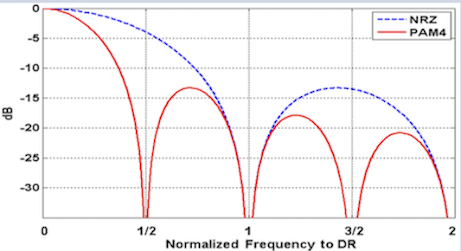
PSD Plot comparison of NRZ(PAM2) and PAM4:
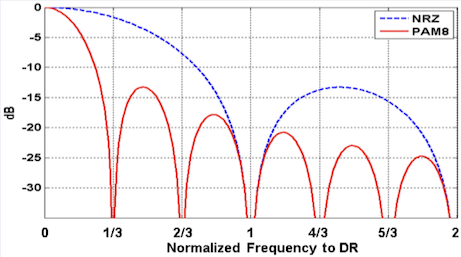
PSD Plot comparison of NRZ (PAM2) and PAM8:
Data Rate
We can infer the symbol rate from the above PSD plots for NRZ vs. PAM2 and PAM8. The spacing between significant power levels or peaks in the plot provides an indication of the symbol rate. The symbol rate in the case of PAM4 is double the NRZ and triple for PAM8. This means the data rate is doubled in the case of PAM4 and tripled in the case of PAM8. Now, why don’t we keep increasing the number of levels? The reason is that an increased data rate comes with its tradeoffs which we will see shortly.
Spectral Efficiency (SE)
From the above PSD plots, it’s clear that PAM4 and PAM8 have higher symbol rates for the same occupied frequency as NRZ. This means the data rate doubles or triples for the same frequency bandwidth required to send the signal, which tells us that PAM4 has a higher SE than PAM2 (NRZ) and PAM8 has a higher SE than PAM4. For example, for 112Gbps, Nyquist frequency (or fundamental frequency) for PAM2 is 56Ghz, PAM4 is 28GHz, and PAM8 is 18.66 GHz.
Complexity and Power
PAM2(NRZ) is more straightforward in implementation, and complexity increases as we increase the number of bits per level. Because now the receiver needs to be more sensitive in understanding the variations in the levels. The signal power needs to be boosted for high modulation. NRZ scheme is cheaper to implement than PAM4 and PAM8 and requires less power.
Noise and Error Rate
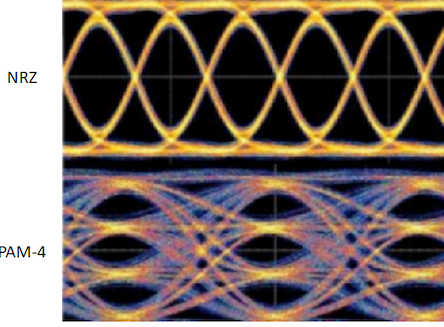
PAM4 and PAM8 have a noticeable disadvantage compared to NRZ. The amplitudes of PAM4 and PAM8 signals become smaller compared to NRZ. We can visualize this difference using an Eye diagram. The top diagram (NRZ) shows two distinct amplitudes and the transitions between them. The “eye” refers to the open space in the middle of these transitions. A larger eye indicates a more clearly defined distinction between the two levels in the signaling scheme.
The bottom diagram shows three separate “eyes” representing the four distinct amplitude levels of a PAM-4 signal. As expected, the size of these eyes is approximately 1/3 of the height of the NRZ eye. This reduction in eye size results in a loss of more than 9.5dB in Signal to Noise Ratio (SNR) for PAM-4 compared to NRZ. The smaller eye opening makes PAM-4 signals more vulnerable to impairments like reflection and crosstalk. As a result, PAM-4 has a higher inherent Bit Error Rate (BER) than an NRZ signal with the same baud rate.
Eye diagram comparison for NRZ and PAM4:
FEC and Bit Error Rate
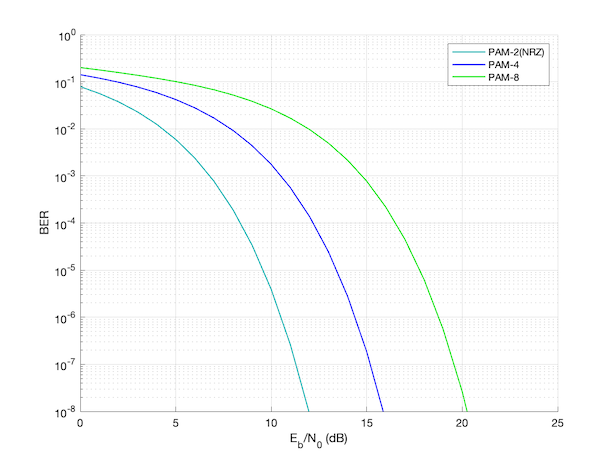
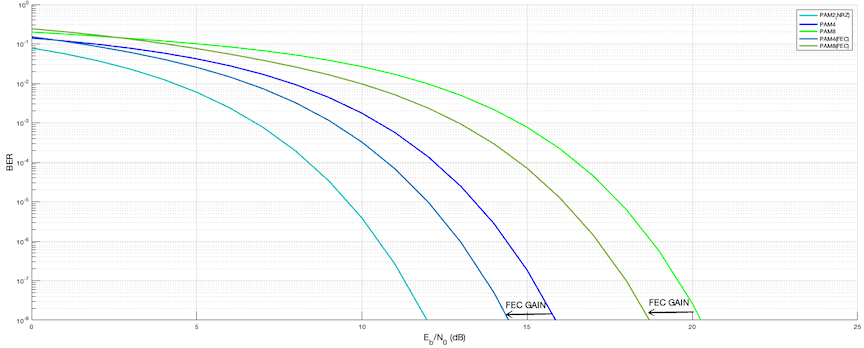
When we increase the number of bits per symbol in amplitude modulation, there is a disadvantage in that the probability of bit errors also increases. However, communication designers have a helpful tool called Forward Error Correction (FEC) to address this issue. Implementing FEC on the receiver side makes it possible to compensate for the bit error rate and improve communication reliability. But the trade-off is that it adds latency.
Below is a plot of PAM2, PAM4 and PAM8 without FEC. To read the plot, locate the desired BER value on the y-axis. Then, follow the corresponding curve until it intersects with the x-axis. The x-axis value at the intersection represents the power level required to achieve that particular BER for the respective modulation scheme. For example, for maintaining a Bit error rate of $10^{-4}$ (0.01%), we can see that the power required to be received on the receiver side increases from PAM2 to PAM4 to PAM8.
Below plot now also shows the FEC gains with PAM4 and PAM8. You can see how it reduces the power required on the receiver side.
Quadrature methods
Certain digital modulation schemes have the term “quadrature” in their name, such as Quadrature Amplitude Modulation (QAM). This indicates that these schemes use two carrier waves that are out of phase with each other by exactly 90 degrees. When two signals are out of phase like this, they are called “in quadrature” or “orthogonal” because their phase difference is one-quarter of a cycle.
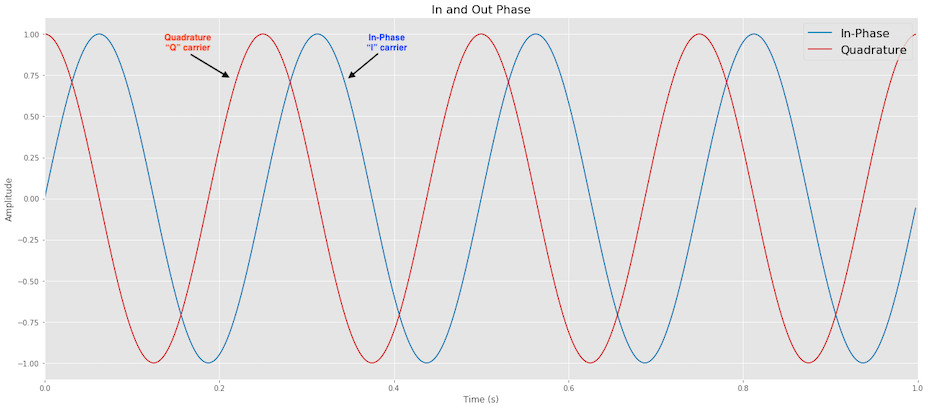
In these modulation schemes, the information to be transmitted is split into two data streams. Each data stream is used to modulate one of the carrier waves. These modulated carrier signals are then combined and transmitted. At the receiver, the incoming signal is separated into parts and demodulated, and the two data streams are recovered and combined to recreate the original information.
One of the carriers is considered the “in-phase” or “I-carrier,” while the other carrier, which is 90 degrees out of phase, is called the “quadrature” or “Q-carrier.” Each carrier can be modulated using different techniques like amplitude, frequency, or phase shift keying. Quadrature Amplitude Modulation (QAM) is an example of this modulation type, where both carriers are modulated using amplitude shift keying (ASK). The transmitted signal consists of the modulated I-carrier, and Q-carrier added together.
The basic quadrature modulator circuit includes a local oscillator, a frequency-shifting network, two mixers, and an adder circuit. The I-input and Q-input data streams modulate the I-carrier and Q-carrier, respectively. The local oscillator generates the high-frequency carrier signal. The mixers combine the carriers with the corresponding data streams, and the resulting modulated I-carrier and Q-carrier signals are added together by the adder circuit, which outputs the final signal to the transmitter.
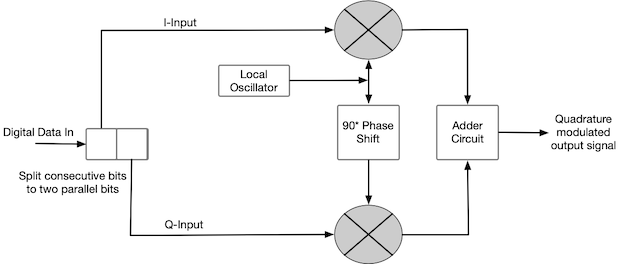
It’s important to note that while the term “quadrature amplitude modulation” implies amplitude shift keying, it is also used more broadly to refer to a family of modulation schemes that may involve a combination of amplitude shift keying and phase shift keying. You may have heard another term for this Coherent modulation.
QPSK
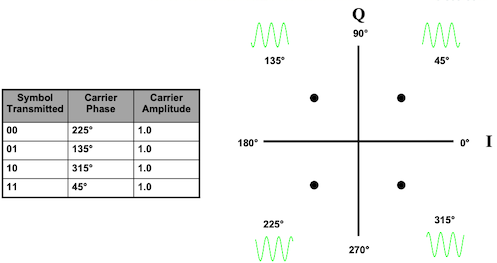
QPSK, which stands for Quadrature Phase Shift Keying, is a modulation technique where the signal shifts between different phase states separated by 90 degrees. These phase states occur at 45, 135, 225, and 315 degrees.
In QPSK, the input is a stream of binary digits at a data rate R. This input stream is divided into two separate streams, each with a data rate of R/2 bits per second. The two streams are called the I (in-phase) and Q (quadrature-phase) streams. Each symbol in QPSK represents two bits.
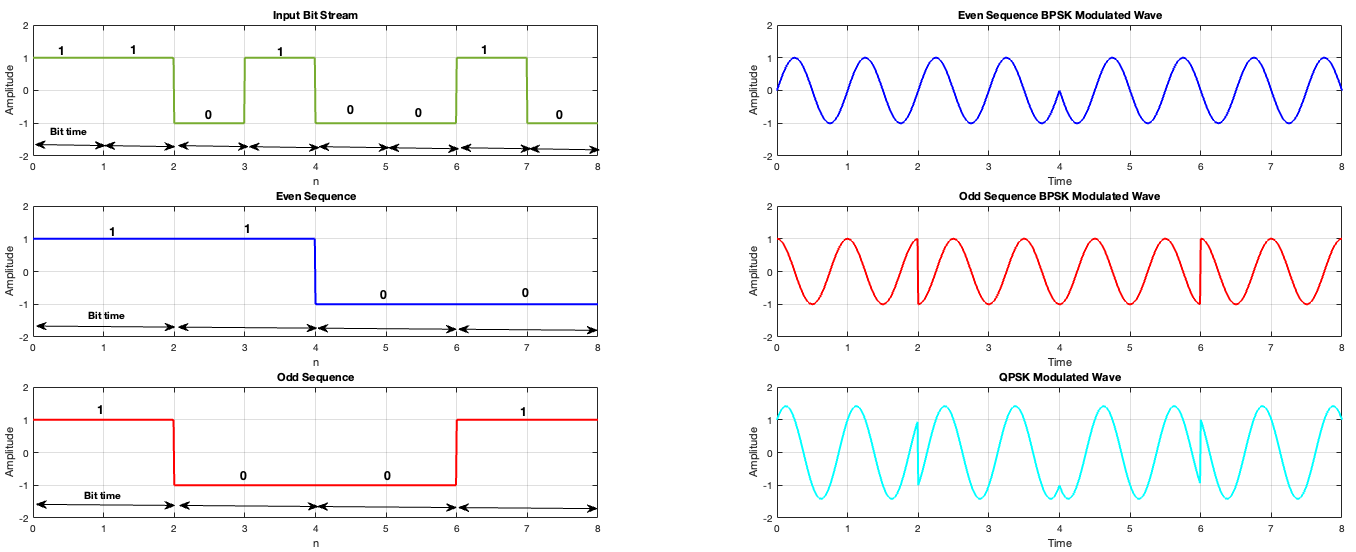
Let’s take an example: Suppose we have an input stream of $1 1 0 1 0 0 1 0$. This stream is split into two streams: the odd stream $1 0 0 1$ and the even stream $1 1 0 0$. Each stream is modulated individually, and then the modulated signals are combined.
In the graph representing the QPSK modulated wave, you can observe the bit times. Since we are splitting the data into two separate streams, the bit time increases. This means that we can transmit the same amount of data using less frequency bandwidth and keeping the amplitudes of the signal same.
QAM
Quadrature Amplitude Modulation (QAM) is a modulation technique that combines both amplitude and phase shift to encode binary data. In the case of QPSK, we focused only on phase modulation.
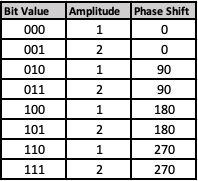
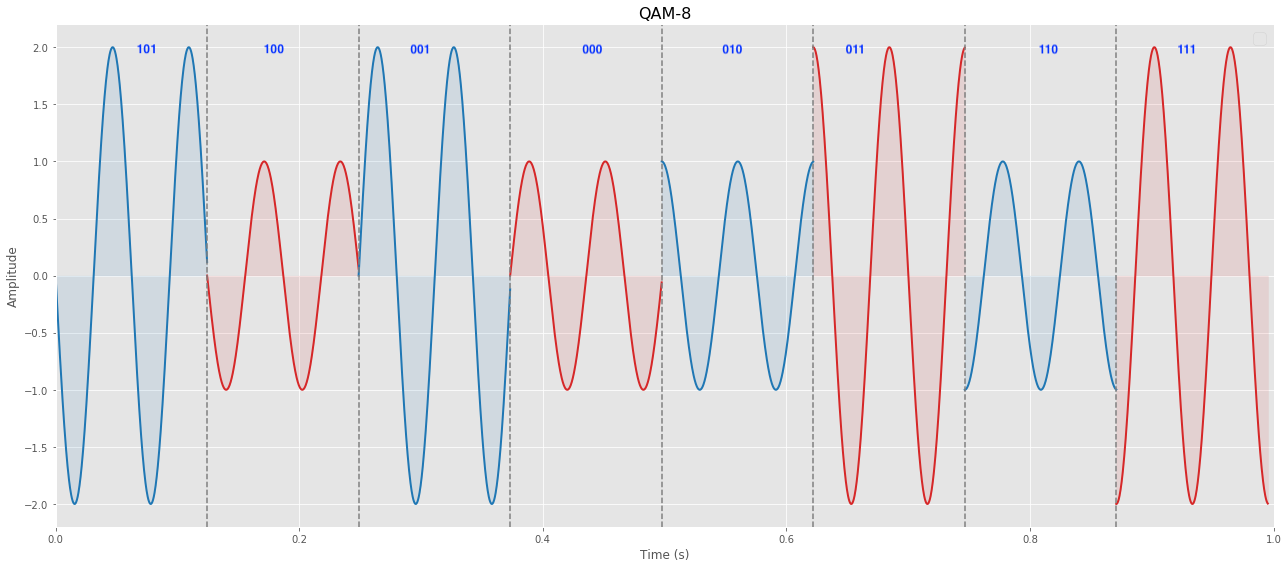
To understand this concept, let’s consider a simple example. Instead of having just one amplitude, let’s imagine we have two amplitudes, which we’ll call 1 and 2. We also have four possible phase shifts. We can create eight different states by combining these amplitudes and phase shifts. In this case, we will use 3 bits to represent each state. The diagram illustrates a QAM8 signal with four phase angles and two different amplitudes (2 and 1). This signal is used to encode 3 bits of information in each symbol.
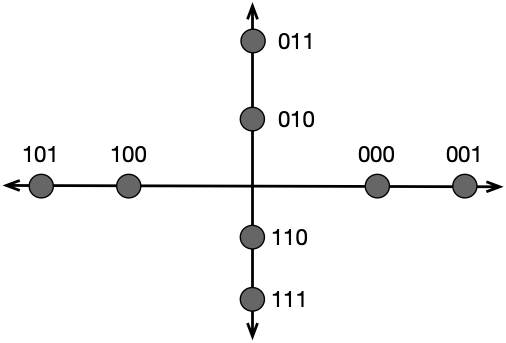
Another way to represent the different amplitudes and phases is through a constellation pattern. This pattern helps visualize the different states and their corresponding combinations of amplitude and phase.
In addition to QAM8, there are other higher-level QAM modulations, such as QAM16, QAM32, and QAM256. As the number of states increases, the data rate also increases. However, it’s important to note that with higher numbers of states, there is a higher likelihood of errors due to noise and attenuation.
Conclusion
In conclusion, we have explored some fundamental concepts of modern digital communication, focusing on the relationship between different concepts and the tradeoffs involved in choosing one modulation technique over another. While we have only touched the surface of this vast topic, my intention was to provide an overview and highlight the interconnectedness of these concepts.
It’s important to note that the field of digital communication is constantly evolving, and there is always more to learn. If you come across any mistakes or have any further questions, please don’t hesitate to reach out. Your feedback is valuable and greatly appreciated.
References
Data and Computer Communications
Essentials of Modern Communications
Digital Modulations using Python
Ricketts lab design lectures
Tutorials on Digital Communications Engineering
Data Communications and Networking